

TL;DR:
- Effective server optimization begins with measuring resource utilization to identify actual bottlenecks before making configuration changes. Benchmarking parameters like CPU, memory, I/O, and network under peak load guides targeted tuning, such as adjusting kernel settings, controlling swap behavior, and optimizing concurrency models for workload-specific performance gains. When hardware limitations are reached, deploying dedicated resources and load balancing ensures sustained high performance and resilience.
Slow response times, spiking load averages, and application timeouts are symptoms most system administrators know well. The frustrating part is that understanding how to optimize server performance isn't just a matter of throwing more hardware at the problem. Many teams apply a single fix, see modest improvement, and miss the deeper bottlenecks still dragging down throughput. This guide walks you through a methodical approach: establishing baselines, applying OS-level tunings, identifying common misconfigurations, and verifying that your changes actually moved the needle.
Table of Contents
- Key takeaways
- How to optimize server performance: prerequisites and baselines
- Step-by-step server optimization techniques
- Troubleshooting common performance bottlenecks
- Verifying impact and iterating your approach
- What I've actually learned from years of tuning servers
- Build your infrastructure on hardware that performs from the start
- FAQ
Key takeaways
| Point | Details |
|---|---|
| Establish baselines first | Profile CPU, RAM, I/O, and network before making any changes to target real bottlenecks. |
| Tune the Linux kernel intentionally | Adjust sysctl parameters like swappiness and TCP buffers based on your workload, not generic recipes. |
| Choose the right concurrency model | Fewer processes with more threads and epoll-based I/O multiplexing scales better than adding worker processes blindly. |
| Measure every change you make | Use Prometheus, Zabbix, or similar tools to confirm improvements and catch regressions before they reach production. |
| Treat optimization as iterative | Fixing one bottleneck shifts pressure to the next resource. Monitor continuously and adjust in cycles. |
How to optimize server performance: prerequisites and baselines
Before touching a single configuration file, you need a clear picture of where your server actually stands. Optimization without measurement is guesswork, and guesswork wastes time and introduces instability.
Hardware components that determine your ceiling
Your server's four core resources — CPU, RAM, storage, and network — each impose distinct constraints, and the workload you run determines which one you will hit first. A compute-bound workload like video transcoding will saturate CPU cores long before it stresses storage. A database handling thousands of concurrent queries will exhaust RAM and I/O bandwidth while leaving CPU headroom to spare.
Matching hardware to workload type is foundational. Running a high-transaction PostgreSQL instance on spinning disks rather than NVMe SSDs is not a tuning problem. It is an infrastructure mismatch that no kernel parameter will fully compensate for. Understanding SSD hosting benefits before you begin tuning saves you from optimizing around a problem that only hardware can fix.
Monitoring tools worth using
Effective profiling requires the right instruments. Below is a practical starting set for most production Linux environments:
- top / htop: Real-time CPU and memory snapshot per process. Use htop for cleaner multi-core visibility.
- iostat: Reveals disk throughput, IOPS, and await times that expose storage bottlenecks.
- ss / netstat: Shows active connections, socket states, and whether you are hitting file descriptor or connection limits.
- perf: Low-level CPU profiling for identifying hot code paths and instruction-level inefficiencies.
- Prometheus + Grafana: Time-series monitoring stack for long-term trend analysis and alerting. Real-time metric tracking through tools like Prometheus and Zabbix is non-negotiable for detecting performance degradation before users report it.
Setting realistic performance targets
Concrete thresholds give your optimization work measurable goals. For web-facing applications, the benchmarks that matter most are a TTFB under 200ms, Largest Contentful Paint under 2.5 seconds, and Interaction to Next Paint under 200ms. These numbers represent the point where users perceive an application as responsive. Falling consistently above these thresholds should trigger a structured investigation, not ad hoc changes.
Capture baseline readings across at least one full traffic cycle before you start tuning. A snapshot taken during off-peak hours will mislead you. You need to know what peak load looks like.
Step-by-step server optimization techniques
With your baselines captured, you can apply targeted changes. Work through these in sequence: OS-level tuning first, then concurrency, then caching, then infrastructure distribution.
1. Tune Linux kernel parameters with sysctl
The Linux kernel ships with conservative default settings that prioritize safety over throughput. These defaults made sense for general-purpose systems, but they impose artificial ceilings on production servers under real load. There are over 1,000 tunable sysctl parameters covering networking, memory, and process management, and a focused subset of them will have outsized impact.
Start with network buffer sizes. Increasing "net.core.rmem_maxandnet.core.wmem_maxto at least 16MB allows the kernel to buffer more data in flight, which directly improves throughput on high-bandwidth connections. Pair this with settingnet.ipv4.tcp_congestion_controltobbrrather than the defaultcubic`. BBR is Google's congestion control algorithm and consistently outperforms cubic on networks with any measurable packet loss or variable latency.
2. Control swap behavior deliberately
The vm.swappiness parameter tells the kernel how aggressively to move memory pages to swap. The default value of 60 causes the kernel to swap even when significant RAM is available, introducing latency spikes that are difficult to diagnose. For latency-sensitive applications, set vm.swappiness between 5 and 10. This keeps data in RAM longer and avoids the I/O penalty that comes from swap reads during peak load.

Setting swappiness too low, such as 0, carries its own risk. If the system exhausts physical RAM, the out-of-memory killer will start terminating processes rather than gracefully swapping. For database servers, 5 to 10 is the right range.
3. Optimize concurrency and I/O multiplexing
Adding worker processes beyond your CPU core count rarely improves throughput. Adding workers past a threshold causes diminishing returns because context switching and memory overhead consume the gains. The better model combines fewer processes with more threads per process, supported by epoll for I/O multiplexing.
epoll allows a single thread to monitor thousands of file descriptors simultaneously. When combined with an event-driven server design, this architecture handles 10,000+ simultaneous connections with memory overhead as low as 4KB per connection. For high-connection workloads like API servers or WebSocket services, this is a material difference versus thread-per-connection models.
Pro Tip: When using edge-triggered epoll (EPOLLET), you must read until EAGAIN on each event or risk missing notifications entirely. Level-triggered mode is safer to start with and easier to reason about under load.
4. Deploy in-memory caching
Serving data from RAM is orders of magnitude faster than reading from disk on every request. Redis and Memcached both solve this well, but they serve different use cases. Redis supports richer data structures (lists, sorted sets, hashes) and persistence. Memcached is simpler and slightly faster for pure key-value retrieval at very high request rates.
Beyond application-level caching, set aggressive HTTP caching headers for static assets. A Cache-Control: max-age=31536000 header on versioned static files means repeat visitors never fetch those assets from your server at all.
5. Apply load balancing when a single server approaches capacity
Load balancing distributes traffic across multiple servers, preventing any single node from becoming the bottleneck. HAProxy is the standard software-based choice for most organizations. It handles SSL termination, health checks, and session persistence well. DNS round robin is simpler but has no health awareness, meaning it will route traffic to a downed node until TTL expires.
Load balancing is not only about capacity. It is also about resilience. A two-node setup with HAProxy in front gives you the ability to take one node offline for maintenance without service interruption.
6. Keep software and firmware current
Kernel versions released in 2024 and 2025 include meaningful I/O scheduler improvements and scheduler latency fixes. Running a kernel from 2020 means leaving those gains on the table. Apply firmware updates for NIC and storage controllers on a scheduled basis. Vendor firmware updates frequently address throughput regression bugs that no amount of sysctl tuning will compensate for.
Troubleshooting common performance bottlenecks
Even well-configured servers develop problems over time. Knowing where to look and what patterns to expect shortens your diagnosis time.
CPU bottlenecks are not always what they appear to be
High CPU wait time (wa column in top) is not a CPU problem. It is a symptom of slow I/O. The CPU is idle, waiting for disk reads or writes to complete. If you see sustained I/O wait above 5 to 10%, investigate your storage subsystem before touching CPU-related parameters.
True CPU saturation shows as high us (user) and sy (system) time with low idle. At that point, look at process-level CPU usage to find the culprit. CPU underutilization combined with high I/O wait is one of the most commonly misdiagnosed performance patterns in production Linux environments.
Memory problems beyond simple exhaustion
- Memory leaks: A process that grows steadily over hours or days without releasing memory. Track with
smemorvalgrindin staging. - Swap thrashing: The system swaps pages in and out continuously under load, causing I/O to spike alongside latency.
vmstat 1will showsiandsocolumns spiking. - Huge pages misconfiguration: Huge pages reduce CPU overhead by managing memory in 2MB or 1GB chunks rather than the default 4KB. For databases like MySQL or PostgreSQL, enabling transparent huge pages can significantly reduce page table overhead. However, disabling transparent huge pages globally hurts general-purpose workloads. Disable them selectively, at the process level, for workloads that benefit.
- OOM kills: Check
/var/log/kern.logordmesgfor OOM killer entries. These are often silent failures in production.
The danger of applying generic sysctl recipes
Sysctl configurations copy-pasted from blog posts are calibrated for someone else's workload, not yours. Applying a 'performance tuning' recipe without profiling first is how you introduce subtle regressions that take weeks to connect back to the change. Tune based on what your monitoring tells you, not what worked for a different server.
The success of sysctl tuning depends entirely on profiling first. There is no universal configuration that works across a web server, a message broker, and a database cluster running on the same hardware class. What works for one workload will actively hurt another.
Network bottlenecks
Watch for high retransmission rates in ss -s output. Retransmissions indicate packet loss, which forces TCP to resend data and directly increases latency. On high-throughput servers, also check that your NIC drivers are configured with multiple receive queues and that receive-side scaling (RSS) is enabled to distribute interrupt load across CPU cores.
Verifying impact and iterating your approach
Applying changes without measuring their effect leaves you guessing whether you improved anything or simply added complexity.
Performance metrics that tell the real story
| Metric | Tool | What it tells you |
|---|---|---|
| TTFB | curl -w "%{time_starttransfer}" | End-to-end server response time |
| CPU utilization | top, mpstat | Per-core and aggregate load |
| Disk await | iostat -x | Storage response time in ms |
| Network throughput | iftop, sar -n DEV | Bandwidth saturation and packet rates |
| Context switches | vmstat 1, pidstat | Overhead from process scheduling |
| Memory RSS per process | smem, ps aux | Real memory consumption |
Capture these before any change, immediately after, and then again under full production load. A change that looks good on a lightly loaded server frequently behaves differently at peak throughput.
The iterative cycle
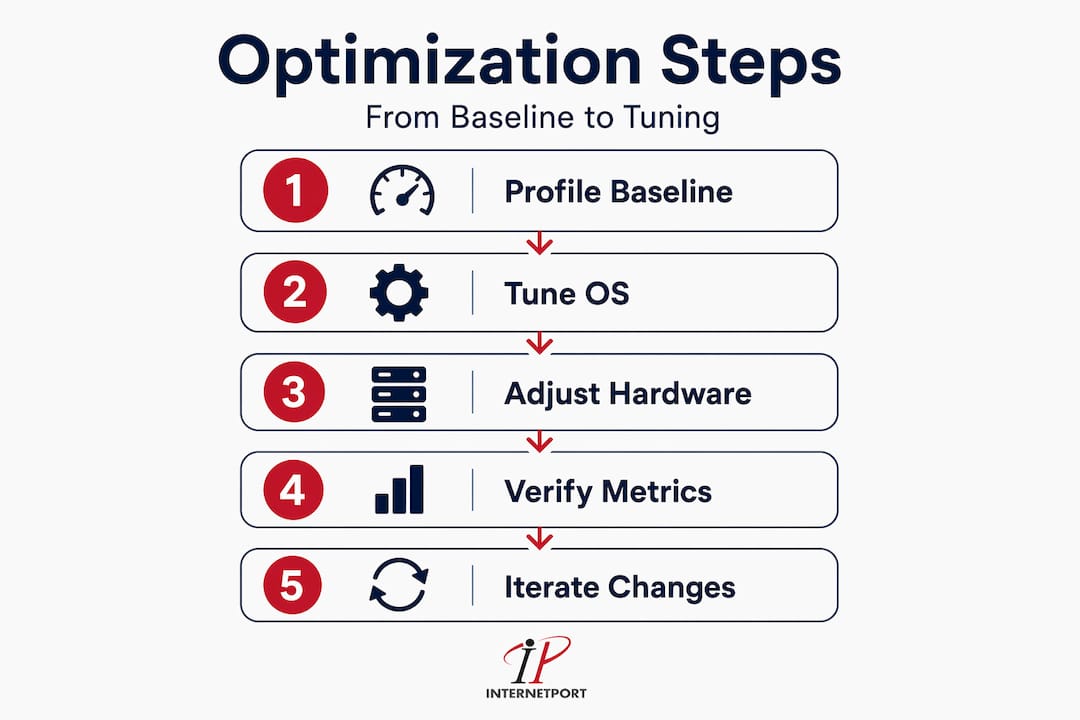
Optimization is iterative by design. Fixing a CPU bottleneck by tuning concurrency will often reveal that RAM or I/O was being masked behind it. Work in cycles: identify the leading constraint, apply a targeted fix, measure the outcome, and then identify the next constraint. Each cycle moves the ceiling higher.
Document every change with a timestamp and the specific metric you were targeting. This record becomes invaluable when a regression appears three weeks later and you need to isolate the cause.
Pro Tip: Automate your baseline metric collection with a cron job that runs iostat, vmstat, and ss every five minutes and ships output to a centralized log. This gives you a historical record to diff against when performance suddenly degrades.
When to consider hardware upgrades or moving to dedicated infrastructure
Software tuning has a ceiling. If you have tuned swappiness, network buffers, concurrency settings, and caching, and your application still cannot meet response time targets under production load, you have likely reached the limits of the current hardware tier. At that point, profiling will reveal which resource is saturated at peak, and the decision becomes: scale vertically, scale horizontally, or move to dedicated resources. For reliable server infrastructure that can absorb the load without requiring constant manual intervention, dedicated hardware is often the right answer for high-demand production workloads.
Monitoring infrastructure should also evolve as your environment grows. Tools like AI-driven network observability can surface anomalies across complex, multi-node environments faster than manual threshold alerts. When you are managing dozens of servers, automated anomaly detection becomes a practical necessity rather than a luxury.
What I've actually learned from years of tuning servers
I have spent a significant amount of time watching engineers apply the same pattern: a performance complaint comes in, someone doubles the RAM or adds CPU cores, the problem quiets down for a few weeks, and then it resurfaces. The hardware change bought time but did not address the constraint.
The most important shift I made was treating every performance problem as a measurement problem first. Before touching anything, I want to know exactly which resource is the bottleneck, at what time of day, and under what load. Improving CPU, RAM, or I/O often just shifts the bottleneck to the next resource in line. If you did not measure before the change, you will not know where the new ceiling is until the next incident.
The other lesson that took time to internalize is that concurrency tuning is highly workload-specific. Multi-threaded models generally outperform multi-process models due to reduced context switching, but that does not mean the answer is always "use threads." Some workloads have shared-nothing architectures that benefit from isolated processes. Some have CPU-bound tasks that respond well to pinning processes to specific cores. The principle is not "use fewer processes." The principle is "understand your workload's I/O and CPU patterns and then choose a model that matches them."
I am also consistently skeptical of anyone who arrives with a sysctl configuration they "always use on production servers." There is no universal config. The settings that work on a high-concurrency API server will harm a database that needs predictable memory access patterns. Tune for the workload you have, not the workload described in someone else's blog post from a different hardware generation.
Patience matters more than most engineers give it credit for. One change at a time. Measure. Wait through a full traffic cycle. Then decide.
— Peter
Build your infrastructure on hardware that performs from the start

The optimization techniques in this guide deliver real gains on well-matched infrastructure. When your hardware tier is already limiting what software tuning can accomplish, the right move is purpose-built dedicated resources. Internetport offers dedicated server options with both Dell PowerEdge configurations and AMD series servers designed for high-demand production environments. Each server comes backed by Internetport's infrastructure in redundant Swedish data centers, SSD storage, and network capacity up to 10 Gbps. If your workload has outgrown shared or virtual environments, Internetport's team can help you match the right dedicated configuration to your actual performance requirements, so you spend less time tuning around limitations and more time running applications at full capacity.
FAQ
What is the fastest way to improve server speed?
Start with monitoring before changing anything. Profile CPU, memory, I/O, and network under peak load to identify your actual bottleneck, then apply a targeted fix. A TTFB under 200ms is a practical baseline target for web-facing applications.
What sysctl parameters have the most impact on performance?
For most production Linux servers, the highest-impact parameters are vm.swappiness (set to 5 to 10 for latency-sensitive workloads), TCP buffer sizes (net.core.rmem_max, net.core.wmem_max), and TCP congestion control (net.ipv4.tcp_congestion_control = bbr). Always profile first to confirm which settings address your specific bottleneck.
How do I increase server capacity without adding hardware?
Use in-memory caching with Redis or Memcached to reduce database load, tune concurrency settings to match your workload's I/O pattern, and apply HTTP caching headers to reduce repeat requests. These changes can significantly extend the useful life of existing hardware before an upgrade is necessary.
When should I consider load balancing instead of single-server tuning?
When a single server approaches resource saturation at peak load, load balancing with a tool like HAProxy lets you distribute traffic across multiple nodes. It also adds resiliency, allowing you to take nodes offline for maintenance without downtime.
Why does my CPU show low utilization but my application is still slow?
High I/O wait (wa in top) means the CPU is idle while waiting for disk operations to complete. This is a storage bottleneck, not a CPU problem. Check iostat for high await times and investigate your disk subsystem or consider moving to faster SSD-backed storage.