
TL;DR:
- Effective VPS management requires monitoring core metrics like CPU, RAM, disk I/O, and network traffic.
- Regularly right-size resources based on usage data to optimize costs and maintain performance.
- Prioritize p99 performance consistency over raw speed to ensure stable, predictable workloads.
Running a VPS without a clear resource management strategy is like driving with no fuel gauge. You might be fine for a while, but eventually you hit a wall. CPU spikes cause timeouts, RAM exhaustion triggers swap thrashing, and your team scrambles to diagnose what should have been preventable. For IT managers at small and medium-sized businesses, these incidents translate directly into lost revenue and damaged credibility. This guide walks you through the full cycle: assessing your current environment, right-sizing your allocation, tuning workloads, and verifying that your changes actually hold.
Table of Contents
- Assessing and monitoring your VPS environment
- Right-sizing resources: When and how to scale up or down
- Optimizing VPS workloads for performance and cost
- Verifying effectiveness: Testing and maintaining your optimizations
- Why predictable VPS performance matters more than raw speed
- Explore flexible VPS and hosting solutions
- Frequently asked questions
Key Takeaways
| Point | Details |
|---|---|
| Monitor real metrics | Track CPU, RAM, disk, and network metrics to spot issues and opportunities before they affect performance. |
| Right-size regularly | Adjust resources up or down based on actual usage to maximize both performance and cost savings. |
| Clean up unused assets | Delete unused snapshots and volumes to avoid waste and lower your VPS bills. |
| Validate with benchmarks | Test optimizations with real workloads and monitor for consistent high-percentile performance. |
Assessing and monitoring your VPS environment
Before you optimize anything, you need to know what you're working with. Jumping straight to configuration changes without a baseline is one of the most common mistakes we see. You might "fix" a problem that doesn't exist while missing the one that's quietly degrading your production environment.
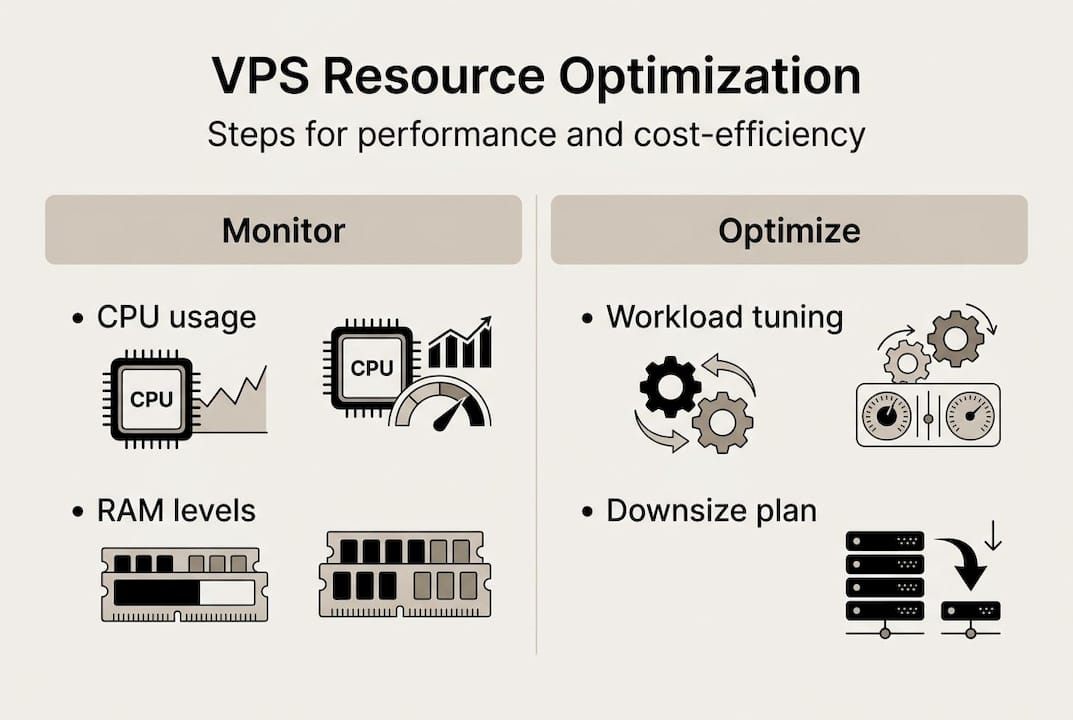
Start by identifying the four core metrics that matter most:
- CPU utilization (p99/p95 and steal time): Average CPU tells you very little. What matters is what happens at the tail. P99 CPU usage reflects the worst 1% of moments, and that's exactly when your users feel the pain.
- RAM consumption: Track both used and cached memory. High cache usage isn't a problem, but consistent pressure on available RAM signals an upcoming bottleneck.
- Disk I/O: Measure read/write throughput and latency. Slow I/O is often mistaken for a CPU problem.
- Network traffic: Watch for bandwidth spikes and sustained high utilization that could indicate runaway processes or DDoS exposure.
For tooling, start with what's already available. "htopgives you a real-time process view.iostat` surfaces disk and CPU I/O wait. For a more visual and persistent view, Netdata is a strong open-source option that runs lightweight on most VPS configurations. Your cloud provider's dashboard adds another layer, especially for network and billing metrics.
One benchmark worth knowing: p99 sysbench CPU scores around 4240 with a coefficient of variation of just 1.8% and steal time of 0.3%, which represents the kind of consistency you should be targeting for production workloads. CPU steal at p95 below 3% is a solid threshold. Anything above that means your VPS host is over-committing physical CPU resources to other tenants, and your workloads are paying the price.
| Metric | Healthy range | Warning threshold |
|---|---|---|
| CPU steal (p95) | < 3% | > 5% |
| RAM utilization | < 75% sustained | > 85% sustained |
| Disk I/O wait | < 10% | > 20% |
| Network utilization | < 70% of cap | > 90% of cap |
Understanding VPS monitoring and its benefits is the foundation for everything that follows. Once you have a baseline, you can make informed decisions rather than reactive ones. Explore your VPS service details to understand what metrics your provider surfaces by default.
Pro Tip: Set automated alerts for p99 CPU anomalies and steal time spikes. Most monitoring tools support threshold-based notifications. Catching a steal time jump at 2 a.m. before it becomes a 9 a.m. incident is exactly the kind of proactive management that separates stable environments from chaotic ones.
Right-sizing resources: When and how to scale up or down
With monitoring in place, the next step is acting on the data to match resources with actual needs. Right-sizing is not a one-time event. It's an ongoing discipline.

Over-provisioning is more common than most teams admit. If your CPU rarely exceeds 15% and your RAM stays below 30% utilization, you're paying for capacity you're not using. Downsize when CPU stays under 10% or RAM under 30%, and reinvest those savings into reserved pricing tiers that can cut costs by 12 to 30 percent.
Under-provisioning has the opposite problem. Symptoms include:
- Sustained CPU above 80% during normal business hours
- Swap usage climbing consistently (a sign RAM is exhausted)
- Disk I/O wait above 20% affecting application response times
- Network latency spikes that correlate with traffic peaks
When you need to resize, do it safely. For most VPS environments, live migration (where the provider moves your instance to a larger host without downtime) is available. If not, schedule a maintenance window during your lowest-traffic period. Always snapshot your current state before making changes. A rollback plan isn't optional.
| Scenario | Recommended action | Expected outcome |
|---|---|---|
| CPU < 10%, RAM < 30% | Downsize to smaller plan | 12-30% cost reduction |
| CPU > 80% sustained | Upgrade CPU allocation | Reduced latency, fewer timeouts |
| RAM swap usage rising | Add RAM or optimize app memory | Eliminated swap thrashing |
| Disk I/O wait > 20% | Switch to SSD or optimize queries | Faster response times |
Review scalable hosting options to understand what upgrade paths are available without full migrations. For practical VPS resource management tips, the key is building a rhythm around your data.
Pro Tip: Schedule a monthly 30-minute resource review. Pull your average and p99 metrics for the past 30 days and compare against your baselines. Slow growth is invisible week to week but obvious month to month.
Optimizing VPS workloads for performance and cost
Optimizing resource allocation alone isn't enough. Let's look at how to tune workloads themselves for efficiency. Even a perfectly sized VPS can underperform if the workloads running on it are poorly configured.
Bandwidth pooling is one of the most underused cost controls available. Instead of assigning dedicated bandwidth caps to each instance, pooling allows your fleet to share a larger bandwidth budget. Individual instances can burst when needed, and you avoid overage fees from isolated spikes.
Snapshot and volume hygiene is another area where costs silently accumulate. Every unused snapshot, orphaned volume, or stale disk image is money spent on storage that serves no purpose. Deleting unused snapshots and volumes is a simple action with immediate cost impact. Teams often discover they're paying for months of forgotten test environments.
For I/O optimization, consider these practical steps:
- Batch large writes: Instead of writing small files continuously, batch them into larger sequential writes. This reduces I/O overhead significantly on both spinning disks and SSDs.
- Use SSDs for hot data: Keep frequently accessed data on SSD-backed volumes. Archive cold data to cheaper storage tiers.
- Tune database query patterns: Slow queries are often the real source of high I/O wait. Run
EXPLAINon your top queries and look for full table scans. - Limit logging verbosity in production: Debug-level logging on a production server generates enormous I/O. Set your log levels appropriately.
For teams running lean efficient VPS configurations, these workload-level changes often deliver more impact than hardware upgrades. Pair them with the server management strategies that apply to your environment.
Pro Tip: Schedule a quarterly audit specifically for orphaned resources. Set a calendar reminder, pull a list of all snapshots and volumes, and delete anything not tied to an active workload. One hour per quarter can save hundreds of dollars annually.
Verifying effectiveness: Testing and maintaining your optimizations
After making optimizations, it's essential to confirm they have the intended effect and maintain performance long-term. Changes that look good on paper don't always behave as expected under real traffic.
Start by setting concrete, measurable targets before you make any change. "Improve performance" is not a target. "Reduce p99 response time from 420ms to under 250ms" is. Specific targets make post-change evaluation objective rather than subjective.
After each optimization, run structured benchmarks. For CPU, tools like sysbench give you repeatable results. For web applications, Apache Benchmark or wrk can simulate realistic load. For database workloads, use pgbench or sysbench's OLTP mode.
"Prioritize p99 consistency over median for production" because your users experience the worst-case scenario, not the average. A server that handles 99% of requests in 100ms but 1% in 2 seconds will generate support tickets and churn, even though the median looks great.
Here's a simple verification workflow:
- Record your baseline metrics (p99 CPU, RAM, I/O wait, response time)
- Apply one change at a time
- Run benchmarks immediately after the change
- Monitor production metrics for 48 to 72 hours
- Compare against baseline and document the delta
Regression is real. A change that improves performance today can degrade it next month when traffic patterns shift. Schedule monthly benchmark runs to catch drift early. CPU p99 consistency with steal under 0.3% is the standard to hold your environment against.
| Optimization | Metric to track | Success threshold |
|---|---|---|
| CPU right-sizing | p99 CPU utilization | < 70% under peak load |
| RAM adjustment | Swap usage | 0 MB active swap |
| I/O tuning | I/O wait percentage | < 10% |
| Workload batching | Disk write throughput | Improved MB/s with lower IOPS |
Review enterprise hosting best practices for additional verification frameworks. Your provider's knowledge base articles are also a practical resource for environment-specific tuning guidance.
Why predictable VPS performance matters more than raw speed
Here's something that gets overlooked constantly: raw CPU speed is a vanity metric for most production workloads. IT teams chase the highest benchmark scores, but the number that actually protects your SLA is p99 consistency.
Median benchmarks mislead because they hide variance. A VPS with a median CPU score of 5000 but a coefficient of variation of 15% will deliver unpredictable performance under load. A VPS with a p99 score around 4240 and CV of 1.8% will behave almost identically every single time. For business-critical workloads, that predictability is worth more than raw throughput.
CPU steal time tells a similar story. High steal means your host is selling more CPU than it physically has, and your workloads lose cycles to other tenants. A steal p95 below 3% means your environment is genuinely isolated. Above 5%, you're sharing resources in ways that will show up as latency spikes at the worst possible moments.
The business advantages of VPS only materialize when your environment is stable and predictable. Optimizing for consistency, not peak performance, is the mindset shift that separates reactive IT teams from proactive ones.
Explore flexible VPS and hosting solutions
The strategies in this guide work best when your hosting infrastructure is built to support them. Resizing, monitoring, and workload tuning all depend on having a provider that gives you the flexibility and transparency to act on your data.
At Internetport, our VPS services are built on SSD storage, include daily backups, and come with Plesk for straightforward server management. Whether you need to scale up quickly or optimize a lean setup with our KVM lowendbox options, we offer plans that match real workload requirements. For teams that also need web presence management, our webhosting plans integrate cleanly with VPS environments. Explore what fits your infrastructure today.
Frequently asked questions
How often should I review my VPS resource allocation?
A monthly review is recommended to track growth trends and avoid both over-provisioning and resource shortages. Downsize when CPU stays under 10% or RAM under 30% to keep costs aligned with actual usage.
How can I tell if my VPS has CPU steal issues?
Monitor the steal metric in your CPU stats. A p95 steal under 3% is solid, while consistent p99 values confirm that your workload performance is reliable and not being throttled by neighboring tenants.
What's the easiest way to reduce VPS costs?
Start by right-sizing: downsize if CPU is under 10% or RAM under 30%, then delete unused snapshots and volumes. These two actions alone often cut monthly bills by 15 to 30 percent.
Why focus on p99 CPU consistency instead of averages?
P99 metrics capture worst-case performance, which is what your users actually experience during peak load. Prioritizing p99 consistency over median scores protects uptime, SLA commitments, and user experience in ways that average benchmarks simply cannot.