
TL;DR:
- Server performance monitoring involves continuously collecting and analyzing system metrics to ensure servers operate efficiently. Tracking the right metrics, like application response time and disk I/O, is essential for early issue detection and maintaining service quality. Using appropriate tools and baselines prevents false alarms and enhances system reliability.
Server performance monitoring is the continuous process of collecting and analyzing key system metrics to confirm that servers operate efficiently and reliably. For IT professionals and system administrators, this practice is the difference between catching a memory leak at 2 AM before it crashes production and explaining an outage to stakeholders at 9 AM. The industry term for this discipline is infrastructure performance management, though "server monitoring" is the phrase most teams use day to day. This guide covers the critical metrics to track, the tools that collect them, a practical setup process, and the pitfalls that trip up even experienced teams. Modern environments, including cloud and containerized workloads, add complexity that makes a structured approach to server monitoring concepts more necessary than ever.
How to monitor server performance: the metrics that matter most
The metrics you track define the quality of your monitoring program. Tracking the wrong ones gives you a false sense of security. The right set tells you exactly where a problem lives before users feel it.
CPU and memory: the obvious starting point
CPU usage and load averages are the first numbers most administrators check, but they require interpretation. A CPU at 95% utilization on a batch processing server at 3 AM is normal. The same reading on a web server during off-peak hours signals a runaway process. Load average tells you how many processes are waiting for CPU time. A load average consistently above the number of CPU cores means the system is saturated.

Memory metrics go beyond raw RAM usage. Swap usage is the critical warning sign. When a Linux server starts writing to swap, response times degrade sharply because disk access is orders of magnitude slower than RAM. Track RSS (Resident Set Size) per process to identify which application is consuming memory, not just the total system figure.
Disk, network, and application metrics
Disk I/O wait and inode exhaustion are frequent silent killers of server responsiveness despite low CPU usage. A server can sit at 50% CPU idle and still be completely unresponsive because the disk queue is saturated or inodes are exhausted. Inode exhaustion happens when a filesystem runs out of file entries, even when disk space remains available. Check both with df -i alongside df -h.
Network performance metrics include bandwidth utilization, packet loss, and connection error rates. A spike in TCP retransmissions often points to a network issue before any application alarm fires. Track these at the interface level, not just the application level.
Application response time is the most critical metric for confirming that a server is doing useful work. Response time correlates directly with user satisfaction. A server with perfect CPU and memory numbers but a 10-second response time is failing its users. Track error rates, thread counts, and request queue depth alongside response time to get a complete picture.
Pro Tip: Use the "golden signals" framework from Google's Site Reliability Engineering practices: latency, traffic, errors, and saturation. These four signals cover the majority of production incidents and give you a focused starting point instead of tracking 50 metrics at once.
The table below maps each metric category to its primary diagnostic tool and the failure condition it reveals.
| Metric category | Primary tool | Failure condition |
|---|---|---|
| CPU utilization | top, Performance Monitor | Sustained usage above 90% |
| Memory and swap | free -m, vmstat | Swap usage above 0 under normal load |
| Disk I/O and inodes | iostat -x 1, df -i | I/O wait above 20%, inode usage above 90% |
| Network throughput | iftop, netstat | Packet loss above 1%, high retransmit rate |
| Application response | APM tools, custom probes | Response time above SLA threshold |
What tools are available for server performance monitoring?
The right tool depends on your environment, your team's skill level, and whether you need real-time visibility or trend analysis. No single tool covers every need, so most production environments use a combination.
Built-in OS tools for immediate diagnostics
Linux ships with a powerful set of real-time resource diagnostics built in. The top command gives a live process list sorted by CPU or memory. iostat -x 1 Shows disk read/write throughput and I/O wait per device every second. iotop -o filters to only processes actively performing disk I/O, which cuts through the noise immediately. On Windows, Performance Monitor (PerfMon) provides equivalent counters for CPU, memory, disk, and network, with the ability to log data over time.
These tools are indispensable for immediate triage. They require no installation and no agent. The limitation is that they show only the current moment. They do not store history, send alerts, or correlate data across multiple servers.
Modern monitoring stacks
Prometheus with node_exporter and Grafana dashboards represents the most widely adopted open-source monitoring stack for Linux environments. Prometheus scrapes metrics from node_exporter agents running on each server and stores them in a time-series database. Grafana then visualizes that data in dashboards you configure. This stack handles alerting through Alertmanager, which routes notifications to Slack, PagerDuty, email, or any webhook endpoint.
Combining system metrics with centralized logs gives administrators the full picture. Metrics answer "what is happening." Logs answer "why it is happening." Without both, you end up SSH-ing into servers manually to read log files after an alert fires, which wastes time during incidents. Tools like the ELK Stack (Elasticsearch, Logstash, Kibana) or Grafana Loki handle log centralization alongside metric collection.
For real-time network visibility and root cause analysis, centralizing logs from network devices, applications, and servers into one platform dramatically reduces the time from alert to resolution.
Pro Tip: Agent-based monitoring gives you richer data, including per-process metrics and custom application counters. Agentless approaches, which poll servers via SNMP or SSH, are easier to deploy but miss process-level detail. Use agent-based monitoring for critical production servers and agentless polling for lower-priority infrastructure.
Polling intervals of 5 to 60 seconds balance data granularity with system overhead in production environments. Critical nodes typically use 5-second intervals. Less critical workloads use 60 seconds. The choice affects both the resolution of your data and the load your monitoring system places on the servers it watches.
How to implement a practical monitoring setup step by step
A monitoring system that nobody trusts is worse than no monitoring at all. Build it methodically and you will have a system your team actually relies on.
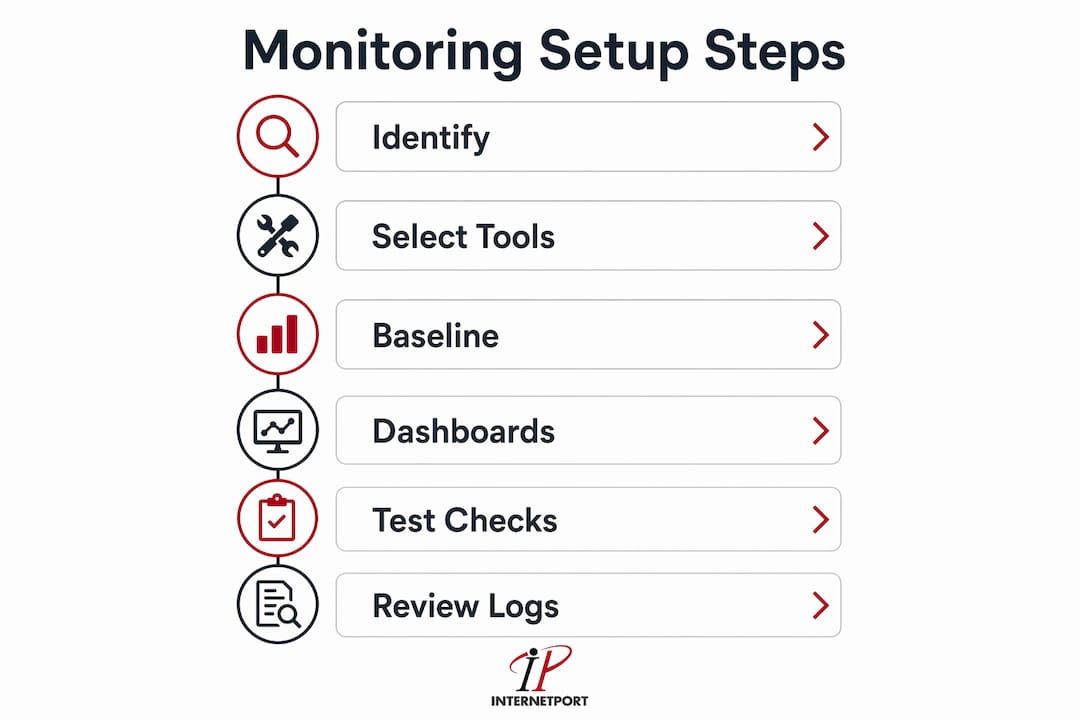
Step 1: Identify critical servers and define scope. Map your infrastructure and classify servers by role: web, database, application, cache, and storage. Each role has different performance characteristics and different failure modes. A database server needs tight disk I/O monitoring. A web server needs response time and connection pool monitoring. Define what "healthy" means for each role before you configure a single alert.
Step 2: Select tools and configure polling intervals. Match your tooling to your environment. Linux-heavy shops benefit from Prometheus and Grafana. Mixed environments may need a commercial platform that handles both Linux and Windows agents. Set polling intervals based on server criticality. Production database servers warrant 5-second intervals. Development servers can use 60 seconds without meaningful loss of visibility.
Step 3: Establish baselines from historical data. Run your monitoring stack for 30–90 days before setting alert thresholds. Historical baselines over 30–90 days are essential to detect abnormal spikes and trends. A CPU spike to 80% means nothing without knowing whether the normal range is 20–40% or 60–75%. Baselines prevent false alarms and give you the context to interpret anomalies correctly.
Step 4: Build dashboards and configure alerts aligned with SLAs. A dashboard should answer a specific operational question in under 10 seconds. Avoid building a single dashboard with 40 panels. Build role-specific dashboards: one for web servers, one for databases, one for network infrastructure. Set alert thresholds at two levels: a warning level that notifies the on-call engineer and a critical level that pages immediately.
Step 5: Test monitoring with synthetic checks. Synthetic monitoring sends scripted requests to your servers on a schedule and measures response time and correctness. This catches failures that metric-based monitoring misses, such as a web server that is running but returning HTTP 500 errors. Tools like Blackbox Exporter for Prometheus handle synthetic HTTP, TCP, and DNS checks.
Step 6: Review logs and metrics regularly to find bottlenecks. Server monitoring enables predictive maintenance by analyzing trends and alerting proactively. Schedule a weekly review of trend data, not just incident response. Look for gradual increases in memory usage, slow growth in disk utilization, or creeping response times. These trends predict failures weeks before they become incidents.
Modern monitoring also extends beyond system metrics. Comprehensive server health checks now include security misconfigurations, TLS certificate expiration, and external dependency health. A database connection failure or an expired API certificate often precedes a full server outage. Build dependency checks into your monitoring from day one. For teams running workloads in cloud or containerized environments, the cloud infrastructure monitoring approach differs significantly from traditional bare-metal setups.
What are common pitfalls when monitoring server performance?
Most monitoring failures are not tool failures. They are configuration and process failures. Knowing the common mistakes lets you avoid them before they cost you an outage.
The observer effect and polling frequency
Excessively frequent polling can itself degrade server performance due to monitoring agent load. Polling every second generates significant CPU and disk overhead on the monitored server, which skews the very data you are trying to collect. This is the observer effect applied to infrastructure. The fix is straightforward: use 5-second intervals for critical metrics and 60-second intervals for everything else.
Disk I/O and inode blindspots
Most teams monitor CPU and memory but skip disk I/O wait and inode counts. This is a costly gap. A server with 50% CPU idle can become completely unresponsive when disk I/O wait climbs above 30% or inodes run out. Add iostat and df -i checks to every server's monitoring configuration, not just storage-heavy systems.
Alert fatigue and dashboard overload
Alert fatigue is the condition where on-call engineers start ignoring alerts because too many fire for non-critical conditions. The solution is not more alerts. It is better-tuned thresholds and a clear escalation policy. Every alert should map to a specific action. If an alert fires and the response is "check it later," that alert should be a warning, not a page.
Effective monitoring focuses on actionable insights over dashboard volume. Combining metrics and logs reduces manual investigation and gives engineers the context they need to resolve incidents faster, without logging into servers to hunt for clues.
- Avoid monitoring every metric available. Track only what maps to a defined failure condition or SLA.
- Set alert thresholds based on baselines, not arbitrary percentages.
- Include runbook links in alert messages so on-call engineers know exactly what to do.
- Review and prune alerts quarterly. Remove any alert that has not led to a meaningful action in 90 days.
- Correlate disk, memory, CPU, network, and application logs before escalating an incident. Single-metric diagnosis leads to wrong conclusions.
Pro Tip: When troubleshooting a slow server, check disk I/O wait first, not CPU. Most engineers reach for top and see a normal CPU reading, then spend 20 minutes looking in the wrong place. Run iostat -x 1 immediately. If %iowait is above 20%, the disk subsystem is your problem.
For teams integrating security into their monitoring workflow, the server security monitoring guide covers how to layer security checks alongside performance metrics without duplicating effort.
Key Takeaways
Effective server performance monitoring requires tracking the right metrics, using tools that combine system data with logs, and building alert thresholds from real baselines rather than guesswork.
| Point | Details |
|---|---|
| Prioritize response time | Application response time is the single most user-facing metric and should anchor your alerting strategy. |
| Watch disk I/O and inodes | Disk I/O wait and inode exhaustion cause outages even when CPU and memory look healthy. |
| Build baselines before alerting | Run monitoring for 30–90 days to establish normal ranges before setting alert thresholds. |
| Match polling intervals to criticality | Use 5-second intervals for critical servers and 60-second intervals for lower-priority workloads. |
| Combine metrics with logs | Metrics show what is failing; logs show why. Use both to resolve incidents without manual SSH sessions. |
What I've learned from years of monitoring real infrastructure
The hardest lesson I've learned is that more data does not mean better visibility. Early in my career, I built dashboards with dozens of panels and alert rules for every metric the agent could export. The result was a team that ignored alerts and a monitoring system that nobody trusted. The real work in monitoring is subtraction, not addition.
The shift to cloud and containerized environments has made this harder. Kubernetes pods spin up and disappear in seconds. Traditional threshold-based alerts fire constantly in these environments because the baseline changes with every deployment. The teams I've seen handle this well treat monitoring as a product, not a project. They assign ownership, run regular reviews, and retire alerts that no longer reflect real failure conditions.
One thing I consistently see underestimated is the value of performance optimization practices that run parallel to monitoring. Monitoring tells you what is wrong. Optimization work prevents the problem from recurring. The two practices belong together in any mature operations program.
My honest recommendation: start with five metrics per server role, build dashboards that answer one question each, and set alerts only where you have a defined response. Expand from there as your team builds confidence in the data. Complexity added before trust is established creates noise, not insight.
— Peter
Server hosting built for teams that take monitoring seriously
Internetport's infrastructure gives IT professionals and system administrators the foundation that makes monitoring actually work. When your servers run on hardware you can trust, monitoring data reflects real application behavior, not platform instability.

Internetport offers dedicated servers, cloud VPS, and web hosting from data centers in Sweden and internationally, all built for teams with serious performance and compliance requirements. PCI DSS compliance, private networking options, and expert technical support mean your monitoring stack integrates cleanly with the underlying infrastructure. Whether you run Prometheus, a commercial APM platform, or a custom agent setup, Internetport's servers give you the full OS access and network flexibility to deploy it without restrictions.
FAQ
What is server performance monitoring?
Server performance monitoring is the continuous collection and analysis of system metrics, including CPU, memory, disk, and network usage, to confirm that servers operate within expected parameters. The goal is early detection of issues before they affect users or cause downtime.
How often should I poll server metrics?
Polling every 5 to 60 seconds is the standard range for production environments. Critical servers use 5-second intervals; less critical workloads use 60 seconds to reduce agent overhead.
What is the most important server performance metric?
Application response time is the most critical metric because it directly reflects user experience. A server can show healthy CPU and memory readings while still failing users if response time exceeds acceptable thresholds.
Why does my server feel slow when CPU usage looks normal?
Disk I/O wait is the most common cause. A server can be 50% CPU idle and completely unresponsive due to disk queue saturation or inode exhaustion. Run iostat -x 1 and df -i to check disk health before investigating CPU or memory.
How do I set alert thresholds without generating false alarms?
Collect 30–90 days of baseline data before setting thresholds. Alerts built on historical baselines reflect actual normal behavior for your specific workload, which eliminates the false positives that cause alert fatigue.