TL;DR:
- Server monitoring continuously tracks server health and performance metrics to prevent costly outages. Proper implementation involves regular baseline setting, threshold tuning, and integrating internal and external data sources for full visibility. Ongoing management, including configuration reviews and metric-log-trace correlation, is essential to avoid monitoring failures.
Server monitoring is the continuous, automated process of tracking a server's health, availability, and performance to keep IT infrastructure running without interruption. Core metrics include CPU usage, memory consumption, disk I/O, network throughput, and process availability. Tools like Datadog and IBM server monitoring solutions collect these signals around the clock, giving IT teams the visibility they need to act before problems become outages. The business case is direct: unplanned server downtime costs enterprises an average of $300,000 per hour, making proactive monitoring one of the highest-return investments in any IT budget.
What is server monitoring and why does it matter?
Server monitoring is defined as the real-time observation and analysis of server resources to detect anomalies, prevent failures, and maintain service reliability. Think of it as clinical health screening for IT infrastructure. A doctor does not wait for a patient to collapse before ordering tests. Monitoring applies the same logic: catch the warning signs early, before a spike in CPU usage or a filling disk takes down a production database.

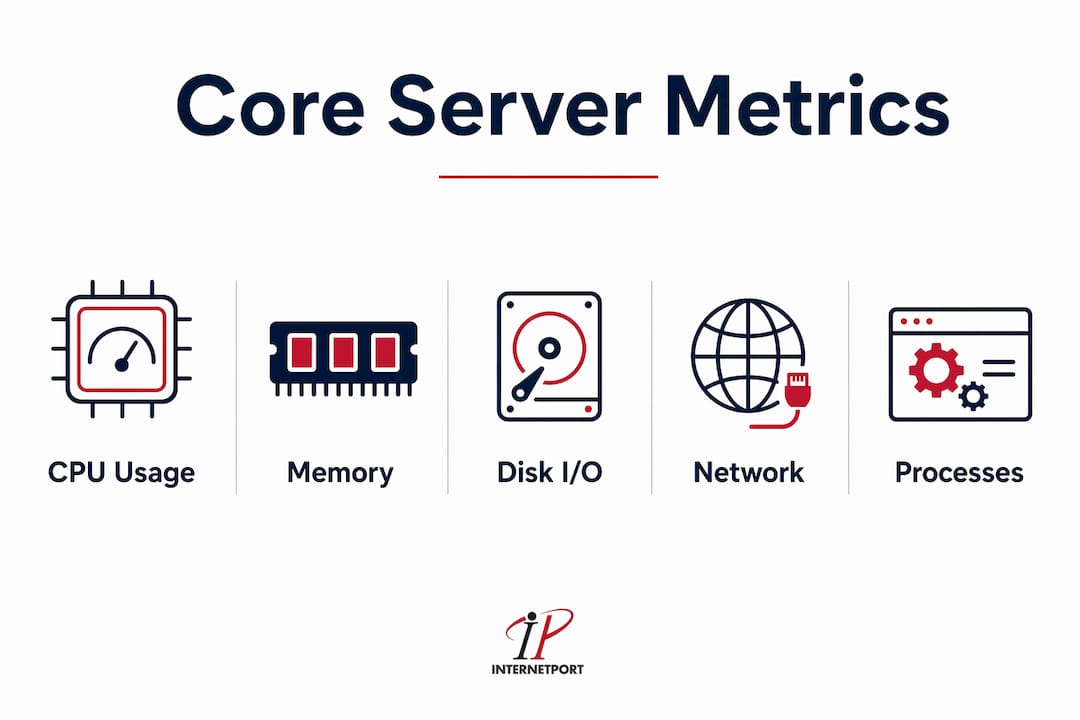
The metrics that matter most fall into five categories. CPU usage shows whether a server is under excessive computational load. Memory consumption reveals whether applications are leaking resources or competing for RAM. Disk I/O tracks read and write speeds, which directly affect database and application response times. Network throughput measures data transfer rates across interfaces. Process availability confirms that critical services like web servers, database engines, and application daemons are actually running.
Without visibility into these metrics, IT teams operate reactively. They find out about failures from end users, not from their own systems. That gap between failure and detection is where downtime costs accumulate fastest. Monitoring closes that gap by shifting the team from reactive firefighting to proactive infrastructure management.
How does server monitoring work?
The server monitoring workflow follows six steps: data collection, transmission, evaluation, alerting, investigation, and reporting. Each step is distinct, and a weakness in any one of them degrades the entire system's effectiveness.
- Data collection gathers raw metrics from the server using either agent-based software installed on the host or agentless protocols like SNMP that query the server externally.
- Transmission sends collected data to a central monitoring platform, either in real time or at defined polling intervals.
- Evaluation compares incoming data against established thresholds and baselines to determine whether values are normal, degraded, or critical.
- Alerting triggers notifications when thresholds are breached, routing them to the appropriate team member via email, Slack, PagerDuty, or similar channels.
- Investigation gives engineers the context they need to diagnose the root cause, using correlated metrics, logs, and traces.
- Reporting documents trends over time, supporting capacity planning, SLA compliance, and post-incident reviews.
Agent-based vs. agentless data collection
Agent-based monitoring installs a lightweight software agent directly on the server. This agent collects internal metrics with high granularity and low latency. It is the preferred method for restricted networks where external access is limited, and it provides tighter security control over what data leaves the host.
Agentless monitoring uses external protocols such as SNMP, WMI, or SSH to pull data without installing software on the target server. This approach is faster to deploy and easier to manage at scale, but it typically provides less depth on internal process-level metrics. The tradeoff is coverage versus convenience.
Setting thresholds and baselines
Thresholds define the boundary between normal and abnormal behavior. A CPU alert set at 90% sounds reasonable until you realize a batch processing server routinely runs at 85% during nightly jobs. Without workload-specific baselines, that alert fires every night and trains your team to ignore it. Baselining means measuring normal behavior over time and setting thresholds relative to that observed norm, not a generic default.
Pro Tip: Set separate threshold profiles for peak hours, off-peak hours, and maintenance windows. A single static threshold applied 24/7 is the fastest path to alert fatigue.
The alerting pipeline is where most monitoring implementations break down. Most teams fail not in collecting data but in routing the right alert to the right person at the right time. An escalation policy that pages a junior engineer for a critical database failure, or sends a Slack message that gets buried, is not a monitoring system. It is noise.
Server monitoring tools: agent-based platforms vs. agentless options
Choosing the right monitoring platform depends on your infrastructure size, team expertise, and the depth of visibility you need. The market offers purpose-built tools ranging from lightweight open-source options to full observability platforms.
| Tool | Type | Key strength | Best for |
|---|---|---|---|
| Datadog | Agent-based + cloud | Metrics, logs, and traces in one platform | Large enterprises, DevOps teams |
| SolarWinds | Agent and agentless | Network and server correlation | Mid-size IT operations |
| Checkmk | Agent-based | Open-source flexibility, low overhead | SMBs and cost-conscious teams |
| UptimeRobot | Agentless (synthetic) | External availability checks | Web-facing services, uptime SLAs |
| ManageEngine OpManager | Agent and agentless | Unified IT monitoring | Mixed infrastructure environments |
Datadog stands out for teams that need to correlate metrics with logs and traces in a single interface. Correlating multiple data sources is critical for reducing the time it takes to identify the root cause of an incident. Viewing a CPU spike in isolation tells you something is wrong. Viewing that same spike alongside application error logs and a slow database query trace tells you exactly what is wrong and where to fix it.
SolarWinds excels at combining server and network monitoring, which matters when a performance issue could originate in either layer. Checkmk is the go-to for teams running on tight budgets who still need enterprise-grade monitoring depth. UptimeRobot handles external synthetic checks, simulating user requests from outside your network to verify that services are actually reachable.
Hybrid monitoring: the strongest approach
Hybrid monitoring combines agent-based internal metrics with agentless synthetic checks. Internal agents catch resource exhaustion, process crashes, and disk failures. External synthetic checks catch routing failures, firewall misconfigurations, and CDN issues that internal agents never see. Running both gives you full-stack visibility from the server core to the end user's browser. For any team running public-facing services, hybrid monitoring is not optional. It is the baseline.
Benefits and best practices for server monitoring
The core benefits of server monitoring are early issue detection, reduced downtime, optimized resource usage, and maintained business continuity. Each benefit compounds the others. Early detection reduces downtime. Reduced downtime protects revenue. Optimized resource usage delays unnecessary hardware spending. Together, they make monitoring one of the most cost-effective practices in IT operations.
For IT teams managing reliable server infrastructure, the following best practices separate effective monitoring programs from ones that generate noise without insight.
- Select metrics with purpose. Monitor CPU, memory, disk I/O, network throughput, and process uptime as a baseline. Add application-specific metrics like query response time or queue depth based on your workload.
- Baseline before you threshold. Collect at least two weeks of normal operational data before setting alert thresholds. This prevents false positives on workloads with predictable spikes.
- Build an escalation policy. Define who gets alerted for which severity level. A disk filling slowly is a warning for a junior admin. A database process crash at 2 a.m. is a critical alert for a senior engineer on call.
- Combine internal and external monitoring. Internal agents catch server-side failures. External synthetic checks catch availability issues that users experience but internal tools miss.
- Review and tune regularly. Monitoring configurations go stale. Servers change roles, traffic patterns shift, and new services get deployed. Schedule a monthly review of alert thresholds and metric coverage.
Common pitfalls to avoid
Default thresholds are the most common failure point in new monitoring deployments. Every major platform ships with generic defaults that were designed for average workloads. Your workloads are not average. A database server, a web server, and a build server each have completely different normal operating ranges for CPU and memory.
Ignoring context is the second major pitfall. A memory usage alert at 80% means something very different on a server with 8 GB of RAM versus one with 256 GB. Absolute values without context mislead engineers and slow down incident response.
Pro Tip: For each server, document its role, expected load pattern, and the specific metrics most likely to predict failure. Attach that documentation to the server's monitoring profile so any engineer on call has immediate context.
How to implement server monitoring in your environment
Implementing server monitoring effectively requires a structured approach, not just installing a tool and hoping for the best. These steps apply whether you are setting up monitoring for the first time or rebuilding a broken implementation.
- Inventory your servers. List every server by role, operating system, and criticality. You cannot monitor what you have not cataloged. Include physical servers, virtual machines, and cloud instances.
- Define monitoring objectives. Decide what you need to know. Availability monitoring answers "is the server up?" Performance monitoring answers "is the server healthy?" Most environments need both.
- Select your tools. Match tool capabilities to your infrastructure. A small team managing 20 servers has different needs than an enterprise running 2,000. Consider tools like Checkmk for smaller environments and Datadog or SolarWinds for larger ones.
- Deploy agents or configure agentless access. Install agents on servers where deep internal visibility is required. Configure SNMP or SSH access for servers where agent installation is impractical.
- Set baselines and configure thresholds. Run the monitoring system in observation mode for two weeks before enabling alerts. Use the collected data to set workload-specific thresholds.
- Build your alerting and escalation pipeline. Define alert severity levels, notification channels, and escalation paths. Test every alert path before going live.
- Integrate with incident response. Connect your monitoring platform to your ticketing system, whether that is Jira, ServiceNow, or PagerDuty. Every alert should create a traceable incident record.
- Plan for scale. As your infrastructure grows, your monitoring must grow with it. Choose platforms that support auto-discovery of new servers and template-based configuration. Review server scaling strategies before your infrastructure outpaces your visibility.
For teams managing dedicated hardware, following proven server management strategies alongside monitoring implementation reduces the risk of gaps between what is deployed and what is observed. Monitoring and management are two sides of the same operational discipline.
Key takeaways
Server monitoring is the foundation of reliable IT operations: without continuous visibility into CPU, memory, disk, and network metrics, teams cannot detect failures early enough to prevent costly downtime.
| Point | Details |
|---|---|
| Core definition | Server monitoring tracks health, availability, and performance metrics continuously to prevent outages. |
| Workflow structure | The six-step process of collect, transmit, evaluate, alert, investigate, and report drives effective monitoring. |
| Tool selection | Match tools like Datadog, Checkmk, or SolarWinds to your infrastructure size and visibility requirements. |
| Threshold discipline | Set workload-specific thresholds after baselining to avoid alert fatigue and missed real incidents. |
| Hybrid approach | Combining agent-based and agentless monitoring gives full visibility from server internals to end-user experience. |
Where most monitoring programs actually break down
I have reviewed monitoring setups across organizations of every size, and the pattern of failure is almost always the same. The data collection layer works fine. Engineers install agents, configure dashboards, and feel confident. Then an incident happens, and the post-mortem reveals that the alert fired but went to the wrong person, or the threshold was so poorly tuned that the alert had been firing daily for months and everyone had learned to ignore it.
The real problem is that monitoring gets treated as a one-time deployment rather than an ongoing operational practice. Servers change roles. Traffic patterns shift. New services get added. The monitoring configuration from six months ago no longer reflects the environment it is supposed to protect.
What I have found actually works is treating monitoring configuration the same way you treat code. Version control it. Review it on a schedule. Assign ownership. When a new server goes into production, the monitoring profile for that server should be part of the deployment checklist, not an afterthought.
The other gap I see consistently is the failure to correlate metrics with logs and traces. Reducing mean time to identify incidents requires looking at all three data sources together, not just watching CPU charts. A server can look perfectly healthy on metrics while silently throwing thousands of application errors in its logs. Metrics tell you something is wrong. Logs tell you what is wrong. Traces tell you where in the call chain it broke. You need all three to cut investigation time from hours to minutes.
The teams that get this right are not necessarily the ones with the most expensive tools. They are the ones who have invested in optimizing server performance as a continuous discipline, not a project with a completion date.
— Peter
Build on a foundation worth monitoring
Monitoring only delivers its full value when the underlying infrastructure is reliable. If your servers are underpowered, poorly configured, or hosted in a facility with weak SLAs, no monitoring tool will compensate for the hardware layer beneath it. Internetport provides dedicated servers and web hosting from PCI DSS-compliant data centers in Sweden and internationally, giving IT teams and business owners a foundation that is built for high availability from the start. With options including cloud VPS, colocation, and dedicated hardware, Internetport supports the kind of infrastructure where monitoring actually pays off. Explore the full range of solutions at Internetport and put your monitoring investment on solid ground.
FAQ
What is server monitoring in simple terms?
Server monitoring is the automated, continuous tracking of a server's CPU, memory, disk, and network metrics to detect problems before they cause outages. It gives IT teams real-time visibility into infrastructure health.
What is the difference between server monitoring and network monitoring?
Server monitoring focuses on the health and performance of individual server resources like CPU and memory. Network monitoring tracks the flow of data across network devices, links, and connections between systems.
What are the most important server metrics to monitor?
The five core metrics are CPU usage, memory consumption, disk I/O, network throughput, and process availability. Application-specific metrics like query response time or queue depth should be added based on the server's role.
How do server monitoring tools collect data?
Tools use either agent-based or agentless methods to collect data. Agents install directly on the server for deep internal visibility. Agentless tools use protocols like SNMP or SSH to query servers externally without installing software.
How often should alert thresholds be reviewed?
Alert thresholds should be reviewed at least monthly and after any significant infrastructure change. Default thresholds do not reflect workload-specific baselines and cause alert fatigue if left unconfigured.